Google Cloud Observability:
Putting Observability Where People Already Work
- 900%more monthly active users
- 3xadoption goal
- AwardCloud Technical Impact
Disclaimer
The following case study is personal and does not necessarily represent Google’s positions, strategies or opinions. I have omitted and obfuscated confidential information.
Summary
Overview
Cloud Observability helps teams watch the health and performance of their cloud infrastructure and apps. In 2022, I partnered with Cloud Monitoring and several Google Cloud teams to bring it into the places people already work.
The problem
Observability lived in its own corner of the console. People had to jump between tools to see how their resources were doing, and adoption across Google Cloud suffered.
What I did
I led the strategy for putting observability data in context on product pages. Then I created the Universal Dashboard Framework (UDF) so any product team could add dashboards that users can customize.
Impact
In-context dashboards drove a 900% increase in monthly active users in year one. UDF beat its adoption goal by 3x and earned the Cloud Technical Impact Award.
Who I brought togetherObservability product managers and the GKE and Compute Engine teams. Together we made the case for in-context dashboards, both teams signed on to build the first ones with us, and UDF then let every product team ship their own.
The Challenge
A standalone product
Observability is how teams understand the health of their infrastructure. Until 2022, it was treated as a separate product with little connection to the rest of Google Cloud.
The Approach
Partnership
I looked at which products needed observability data most in day-to-day work. Google Kubernetes Engine (GKE) and Compute Engine (GCE) rose to the top. With the Observability product managers, I made the case for a close partnership, and both teams signed on to build the first dashboards with us.
Research
Through rolling interviews and rapid research, we focused on two groups: cloud operators, who watch overall system health, and application developers, who care about the key health metrics for their own apps. Their needs only partly overlapped, so the design had to serve both and still fit Google Cloud’s existing navigation.
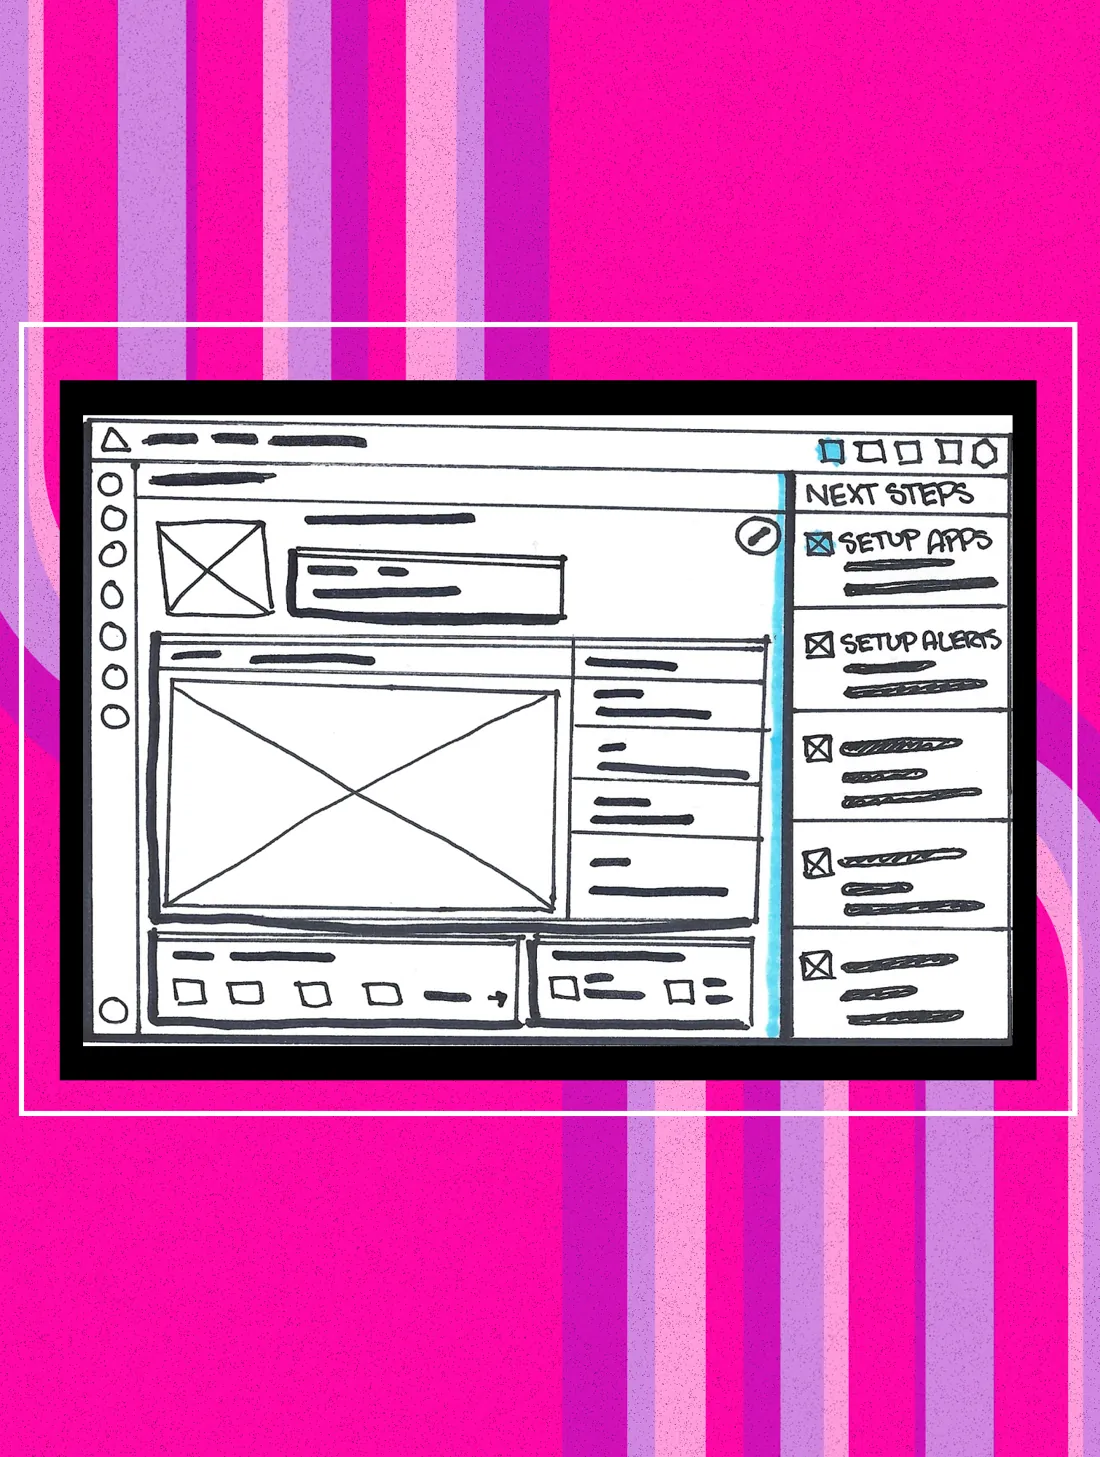
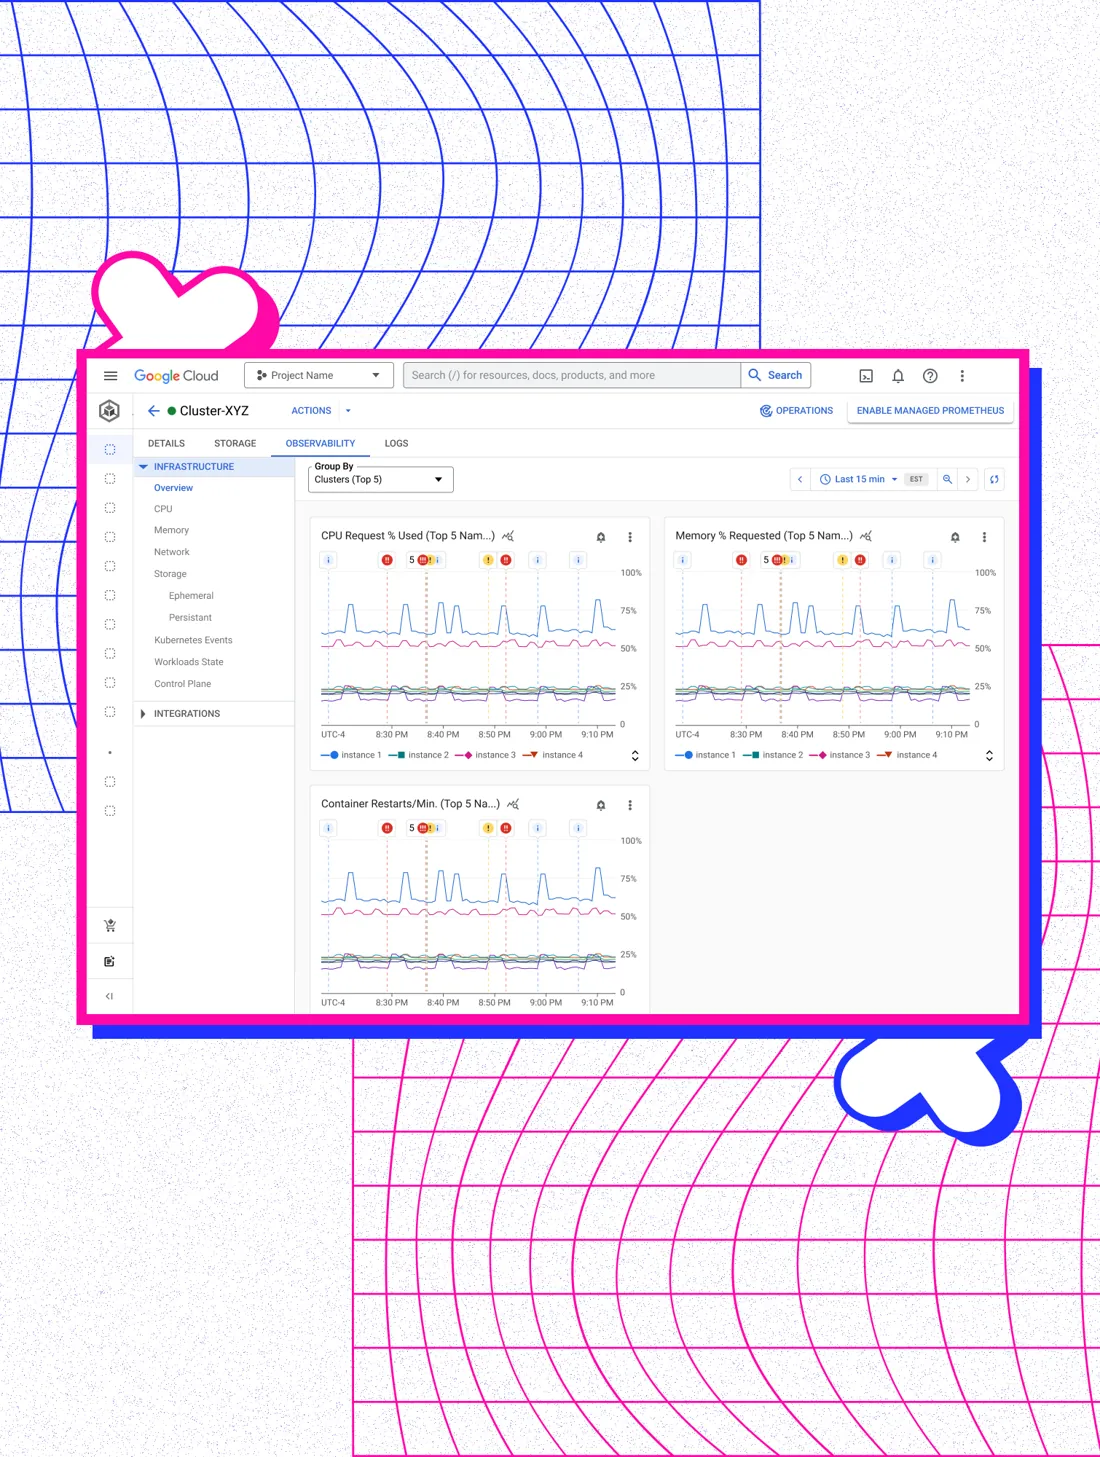
Out-of-the-Box Dashboards
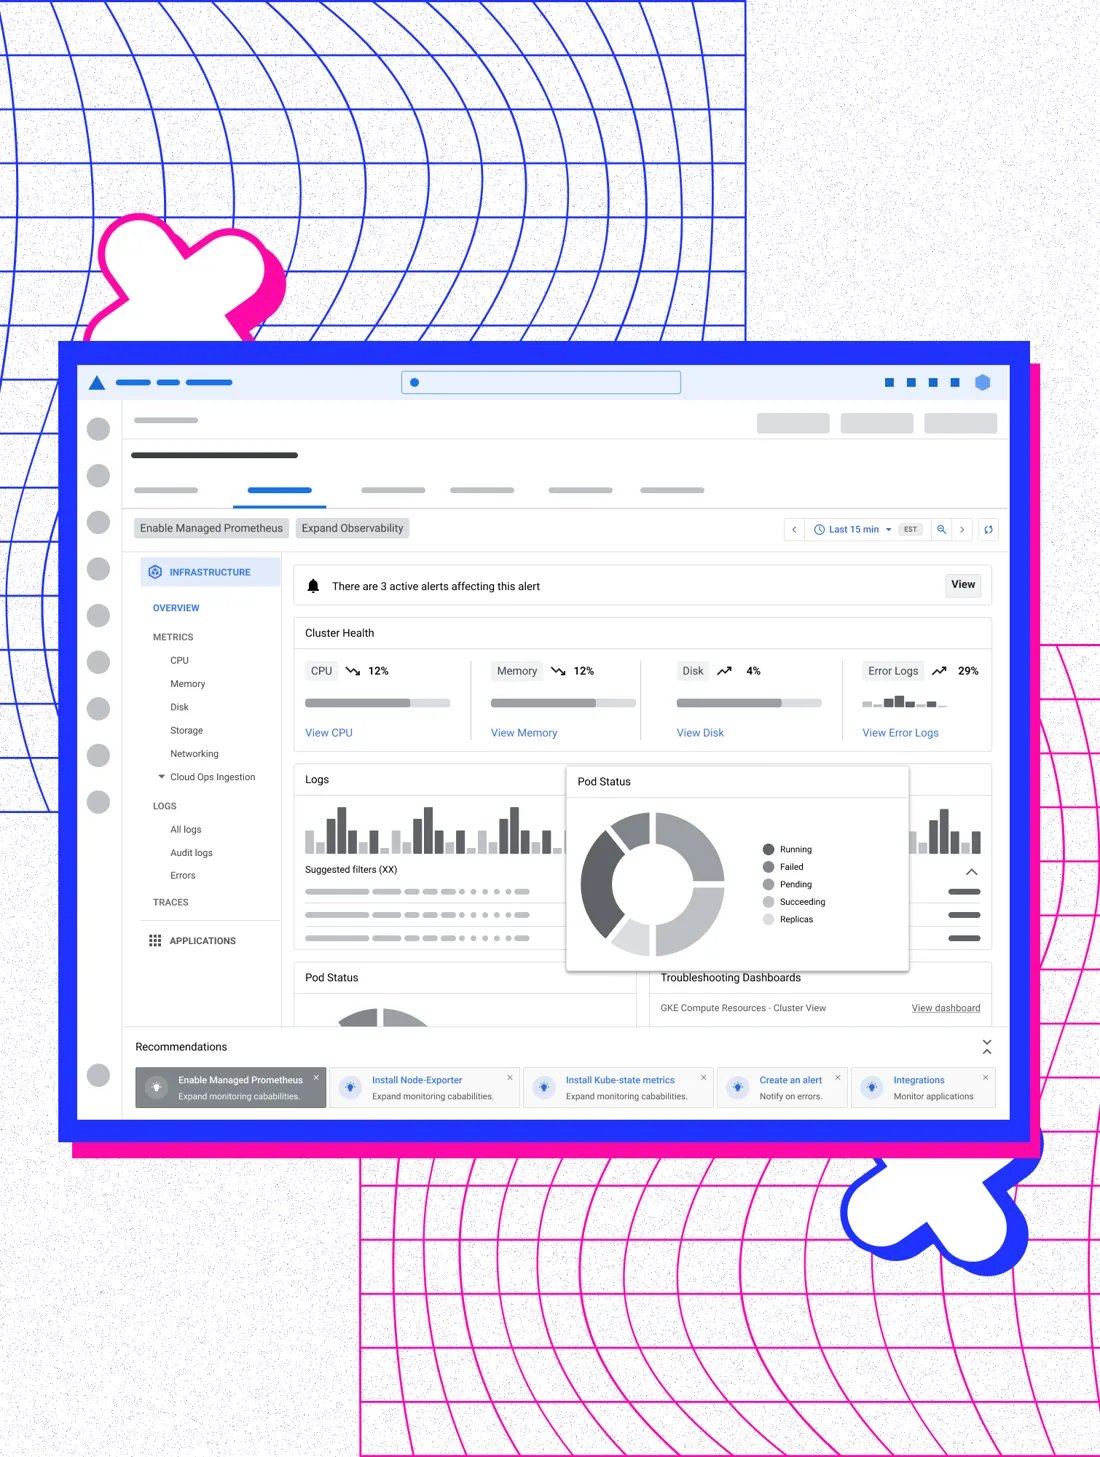
We added an Observability tab to each GKE and GCE resource, like clusters, workloads and VM instances. Prebuilt dashboards sit in a simple tree menu, grouped by infrastructure or application, so people can go from high-level health to app details in one place.
900% more monthly active users in the first year.
They became the most-used dashboards in Cloud Observability.
Scaling Up
More requests than hands
Success brought a wave of partnership requests from other Google Cloud teams. We didn’t have the people to support all of them and keep improving our core product, so we needed something that scaled.
Universal Dashboard Framework
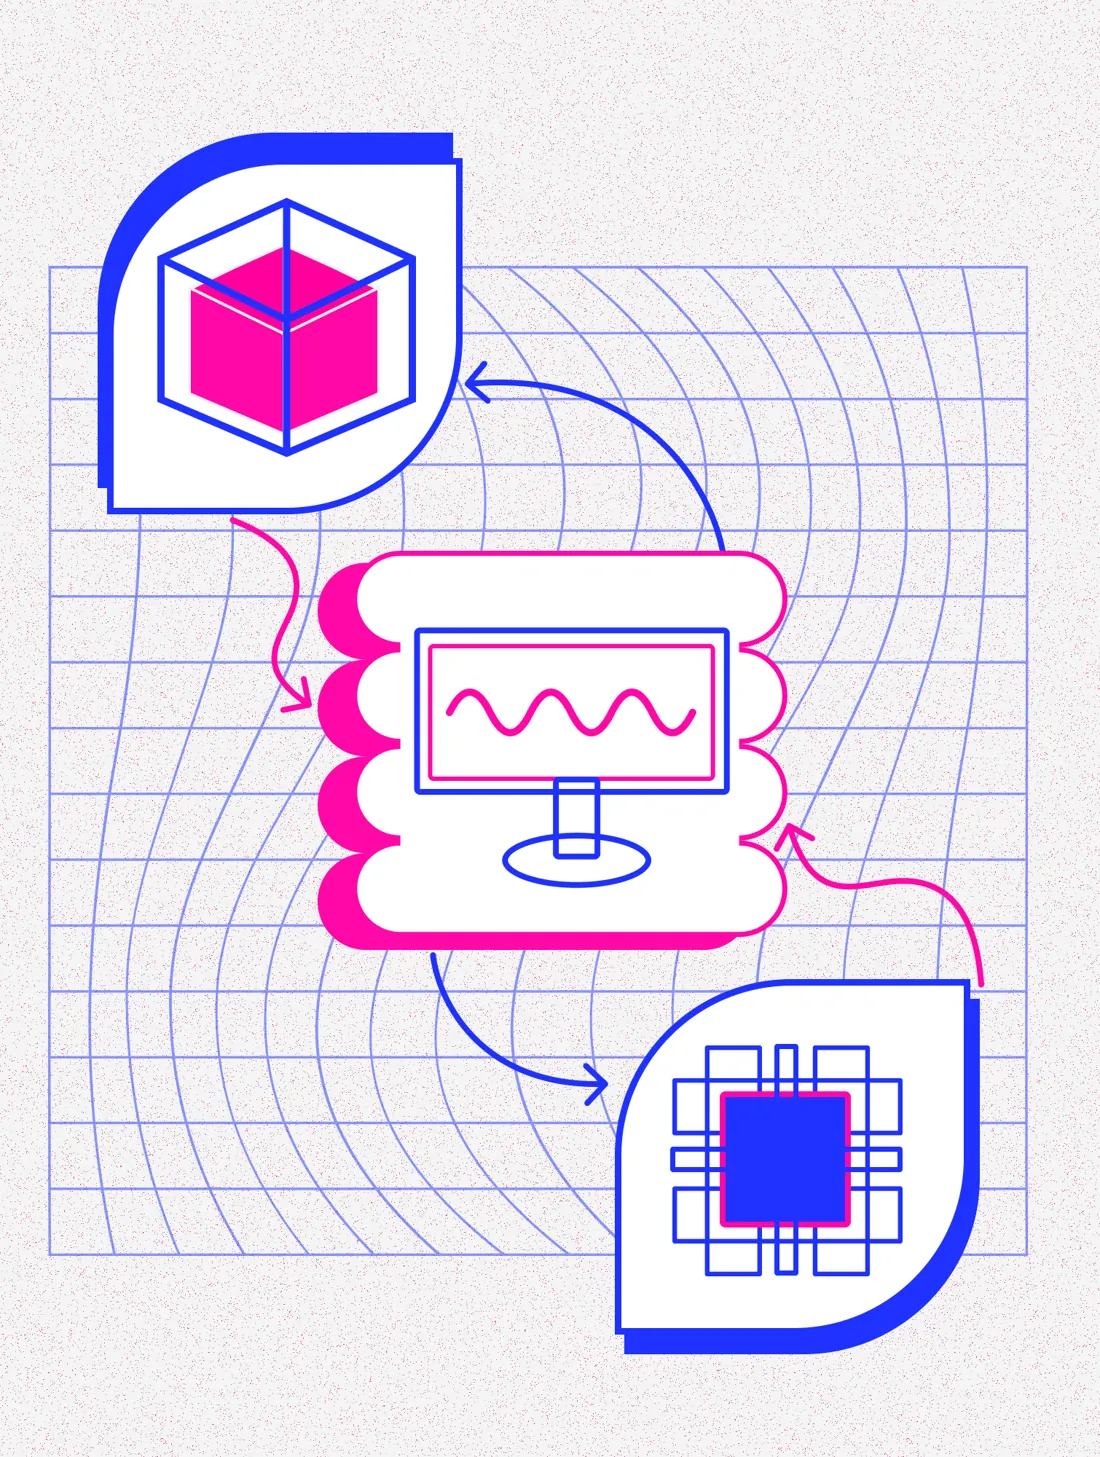
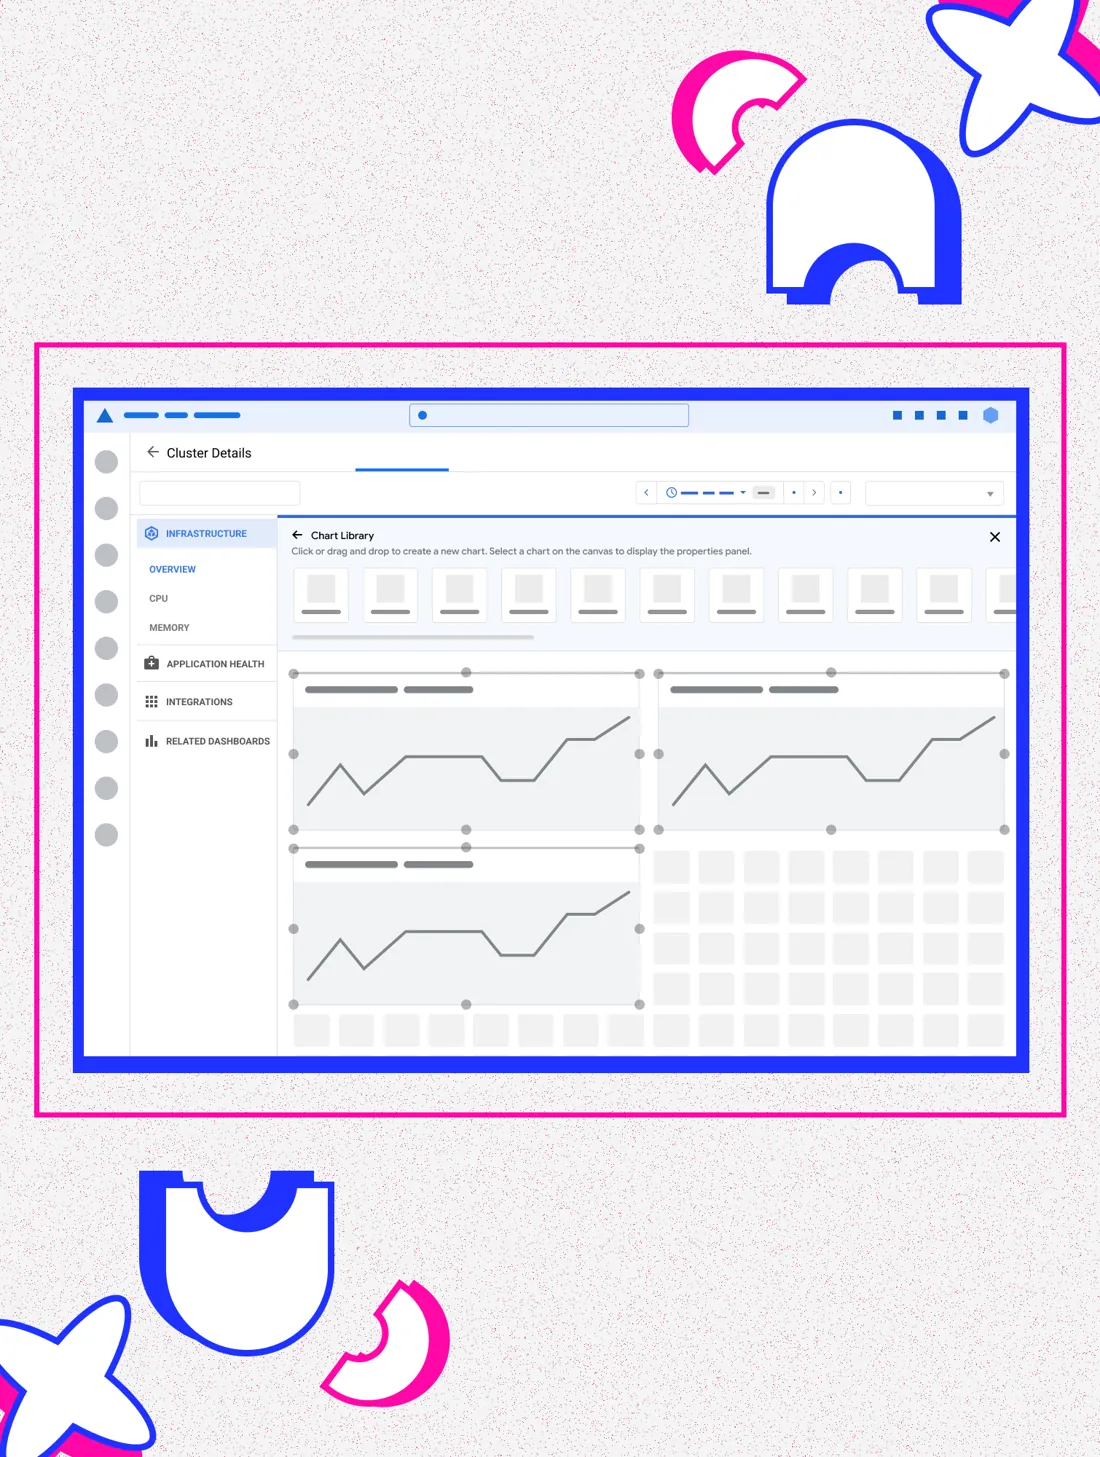
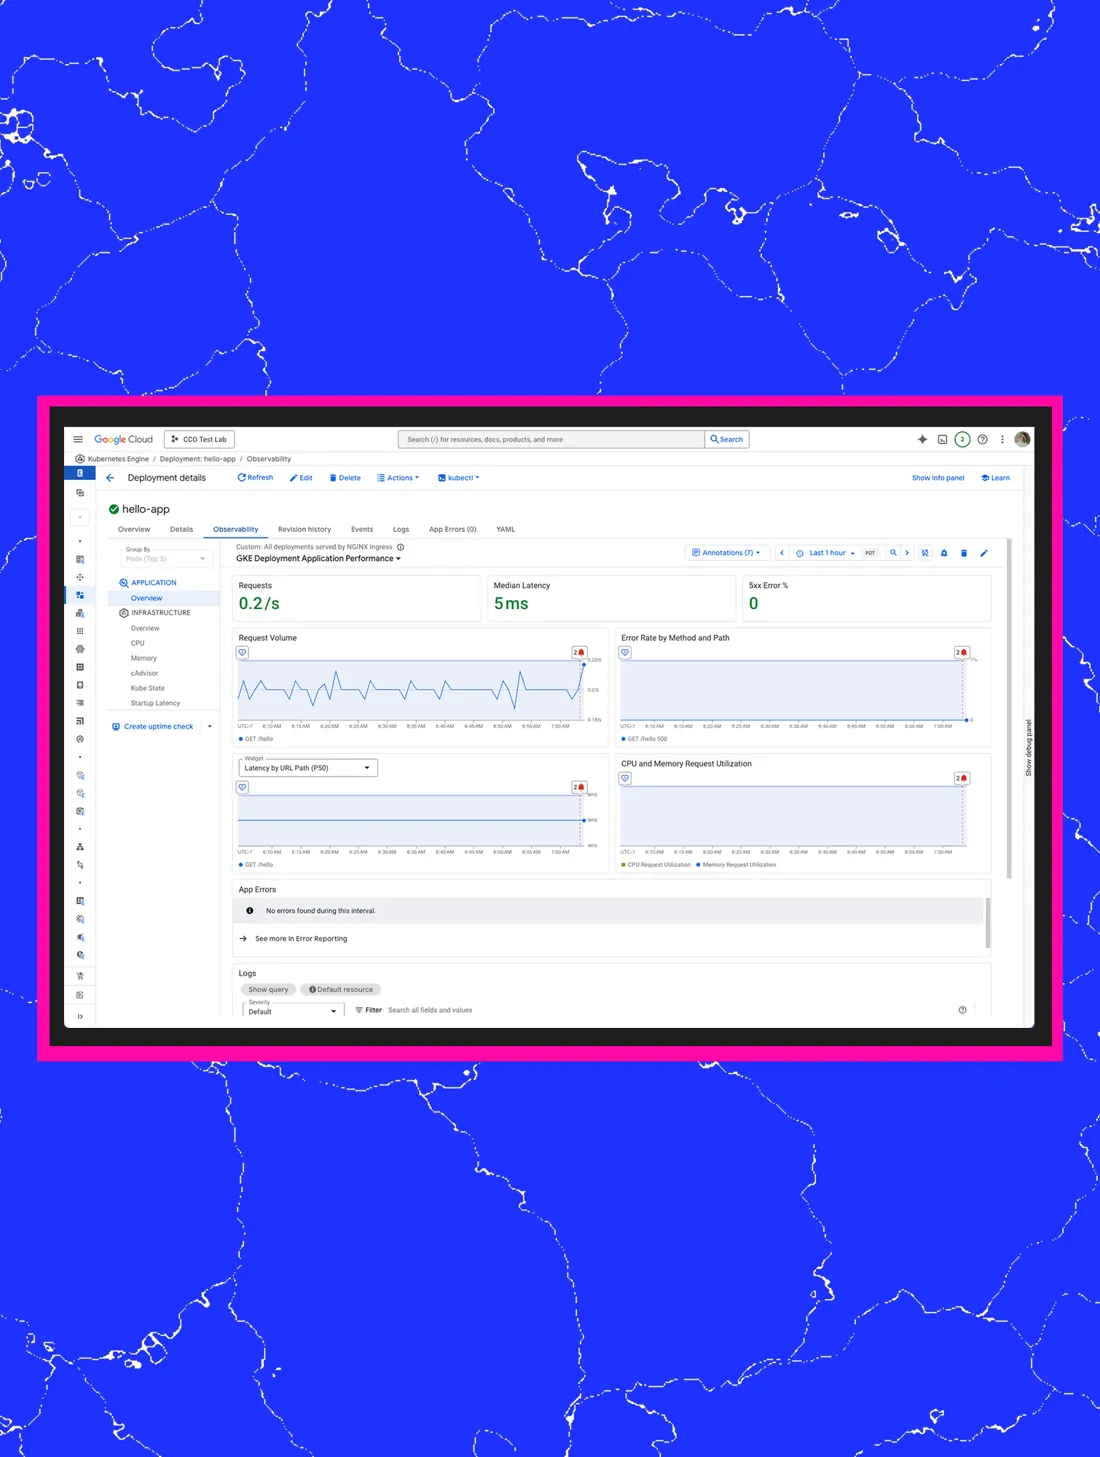
We turned our standalone dashboard builder into a reusable framework, so any product team could ship dashboards and users could make them their own.
UDF had to fit both full and partial pages. After auditing layouts across the platform and several rounds with partner teams, we landed on a compact control bar with the same capabilities as full Observability dashboards.
The key decision
Keep building dashboards team by team, or give teams a framework to build their own?
The options
We could keep building in-context dashboards by hand with each team that asked, or turn our dashboard builder into something any team could use on its own.
What we chose and why
The Universal Dashboard Framework. Product teams know their users best, and we couldn’t staff every partnership and still improve our core product.
The trade-off
One framework had to fit every layout, including partial pages. We gave up some flexibility for a compact, consistent control bar that works everywhere.
Impact
UDF made observability something every Google Cloud product team could ship on its own, and adoption followed.
increase in monthly active users in the first year after launch
our 2023 UDF adoption goal
more repeat use of GKE and GCE dashboards after moving to UDF
In the Wild
Learn more about Google Cloud Observability ↗ · Public coverage of this work.
What people are saying…
Thank you Ashley for your leadership and collaboration in creating a holistic OIC experience for GCP customers that not only solves the user needs but also brings together the various capabilities that Cloud Ops has to offer in a meaningful way.
Thanks to Ashley’s work, the GKE Application View has higher engagement with 3.4x median time on the page and more views per user vs. the infrastructure view.